FortiAnalyzer: Security Management Platform
FortiAnalyzer aggregates log data from one or more Fortinet devices and creates a single platform to view all the reports and events. It can fetch logs from the Fortinet devices once devices are registered to FortiAnalyzer. FortiAnalyzer buffers, reorganises and stores device logs and generates reports according to the settings.
Admin can view, search, configure reports in the FortiAnalyzer portal.
Key Features of FortiAnalyzer
- Reports: Reports of events, activities that occur on registered devices. Collected logs are achieved, filtered, and then checked for compliance or historical analysis purposes.
- Alerts: It identifies the security threat from traffic and quickly generates a notification in logs. We can view alerts through Event Monitor, email, SNMP, or syslog.
- Content Archiving: It verifies that sensitive information doesn’t leak or out of the network.
FortiAnalyzer Operating Modes
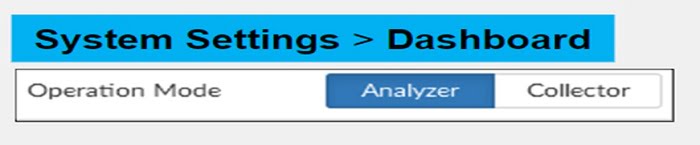
FortiAnalyzer has two modes of log collection.
- Analyzer: It is a default operating mode. When operating in Analyzer mode, the device accesses an essential log aggregator for one or more log collectors.
- Collector: Device collects logs from multiple devices and forwards those logs in binary format to another device. Example- forward logs to syslog server in network.
**SQL is the database language that FortiAnalyzer uses for logging and reporting. Advanced reporting capabilities require some knowledge of SQL and databases.
FortiAnalyzer Administration & Management
You can create multiple administrative accounts in FortiAnalyzer for multiple admins. You can divide administrative tasks among multiple admins like creating log reports, check event logs, monitor dashboard etc.
To protect your network, you can control or restrict administrative access using following methods
- Administrative Profiles: determine the level of access and privileges granted.
- Trusted Hosts: determine where connection can be hosted. It allows access to specific IP addresses or subnets.
- ADOMs: determines which device has access to admin to view and manage logs.
Different types of Administrative Profiles
- Super_User: All system and device privilege are enabled for super user admin. Super_User has maximum rights to access the device settings.
- Standard_User: It has read-write access of device settings but no system access privileged.
- Restricted_User: Read-only access for device tabs/settings and no access to system settings.
Two Factor Authentication in FortiAnalyzer
It means something you have (e-Token) and something you know (credentials/password).
To configure two-factor authentication you need
- FortiAuthenticator: In FortiAnalyzer side you need to create RADIUS server that points to FortiAuthenticator. And then create an administrative account that points to RADIUS Server.
- Forti Token: It is used to verify the identity of user by using Kerberos server.
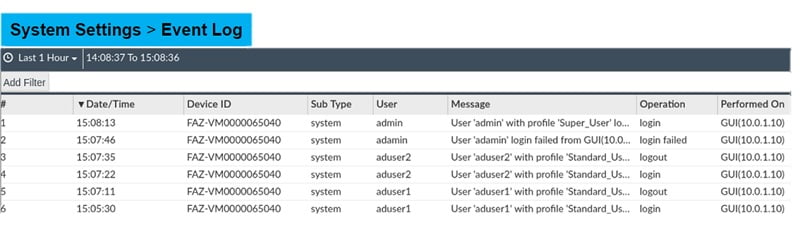
You can monitor auditing logs in FortiAnalyzer and fine-tune the logs by applying filters.
- Go to System setting
- Select Event Logs
- Check logs after applying User filter in the Event Logs
How to Register Devices on FortiAnalyzer for Log Collection
FortiAnalyzer can collect logs from multiple devices. Those devices must be registered with FortiAnalyzer.
There are 3-ways to register any device with FortiAnalyzer
- A request from a registration for a supported device. When an administrator receives a request to add any device, it can be accepted by the admin.
- We can also add devices in Forti Analyzer by using Add Device Wizard which means devices can be added based on their serial number. If device details are correct, it is automatically added or detected by Forti Analyzer.
- FortiAnalyzer admin uses Add Device Wizard along with a pre-shared key. Once a pre-shared key is configured on the device and matched properly, the device is added and registered automatically.
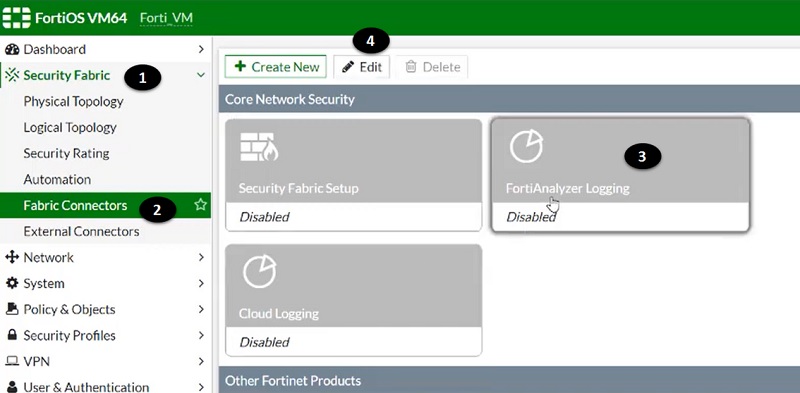
Add FortiAnalyzer in FortiGate Firewall
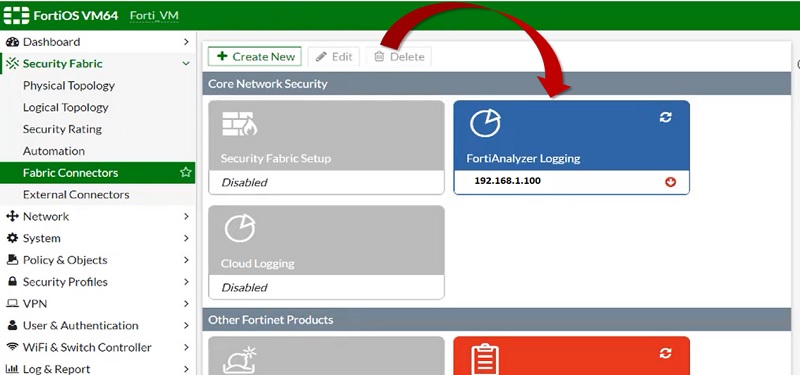
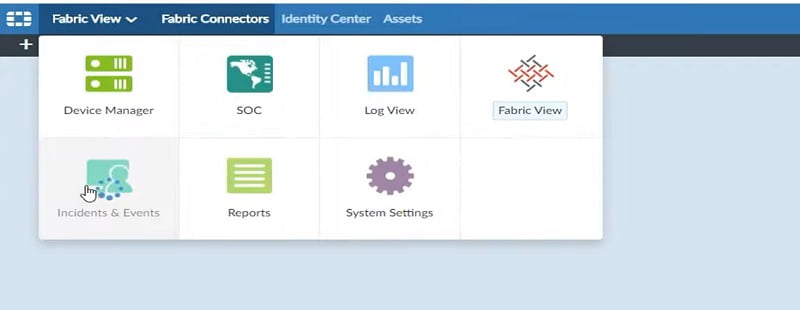
- First add FortiAnalyzer to FortiGate firewall and make it reachable to each other over the network. Go to >> Security Fabric
- Select Fabric Connectors
- Select FortiAnalyzer Logging tab
- Edit the setting
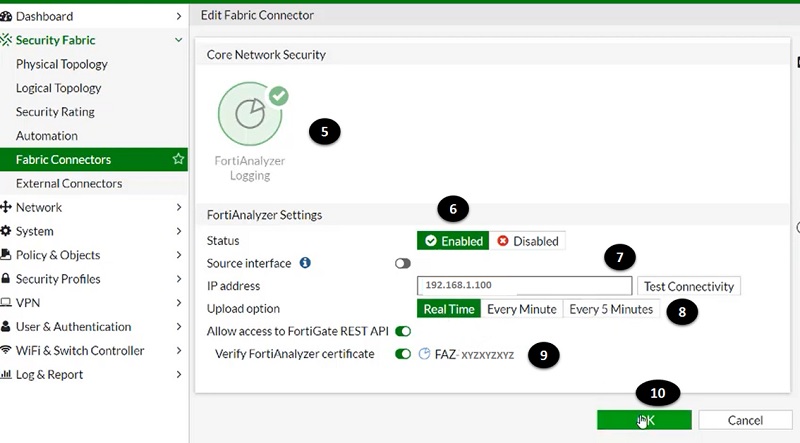
- Once FortiAnalyzer section is open on the dashboard add other values
- Enable the status of FortiAnalyzer setting
- Add IP address of FortiAnalyzer device
- Select logs upload option
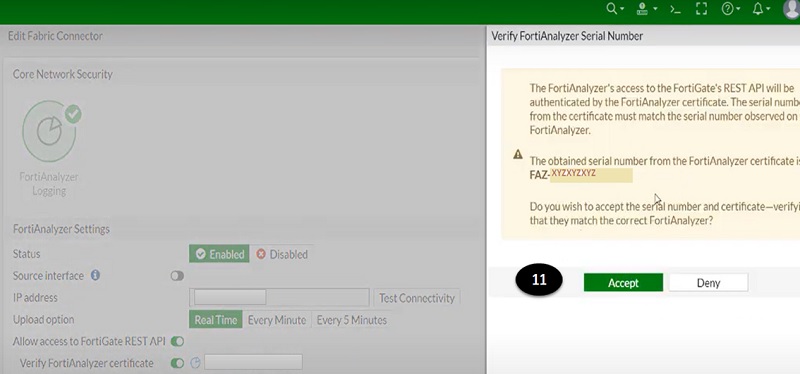
- Verify device certificate by using serial number of FortiAnalyzer
- Select OK
- Accept the serial number certificate verification notification tab.
- Device now successfully added in FortiGate Firewall.
Now, Register FortiGate Firewall in FortiAnalyzer
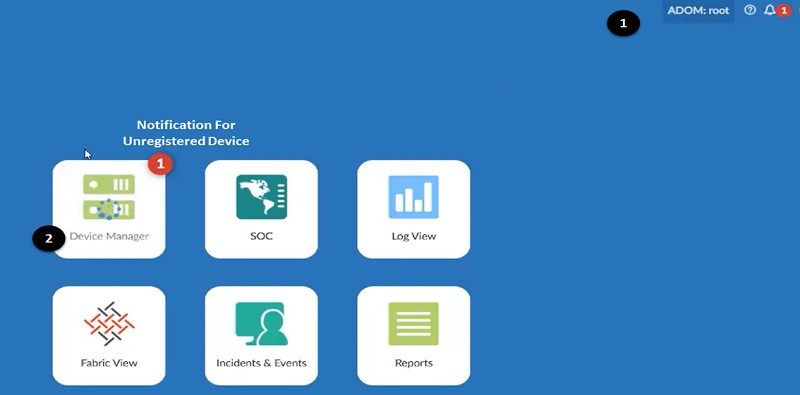
- Login to FortiAnalyzer ADOM and select root ADOM
- You can see a notification for an unregistered device on the screen (FortiGate firewall and FortiAnalyzer are reachable to each other over network hence FortiAnalyzer can detect the unregistered device automatically). Select >>> Device Manager
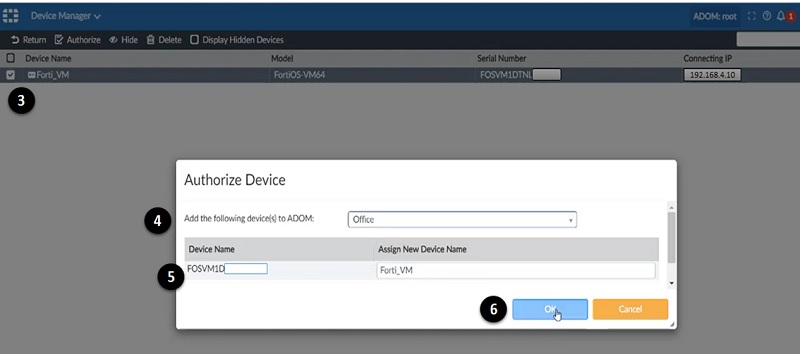
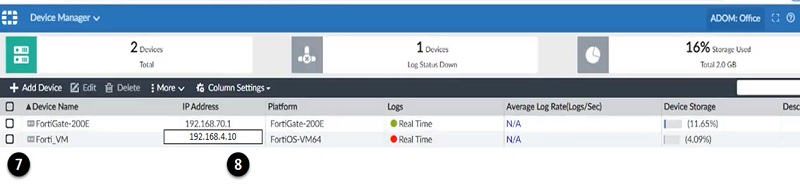
- Once you login to Device Manager, FortiGate firewall details are shown on the screen, but the device is showing Unregistered. Select unregistered device and edit the settings.
- Add ADOM in which this device needs to be registered.
- Verify Device Name, host name or serial number as to authorise the device.
- Select OK
- Once device registered in the FortiAnalyzer, verify Device name
- Verify FortiGate Firewall IP address
Logging
Log messages help you to picture what is going on your network devices, and it tracks service use and identifies any security breaches in a network.
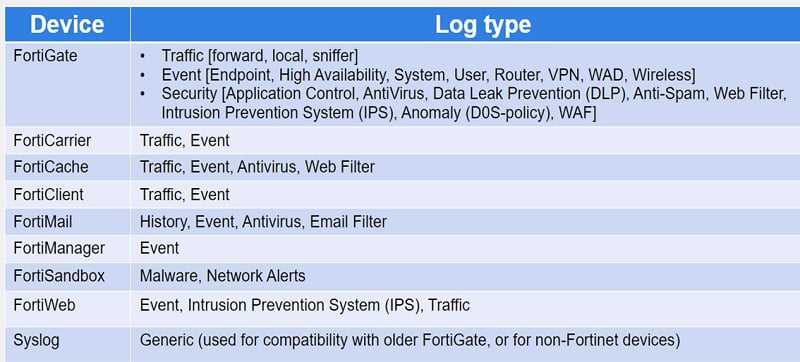
Log type supported by Forti Devices
We can view logs in the Log View tab where we can restrict log view to one or more log group.
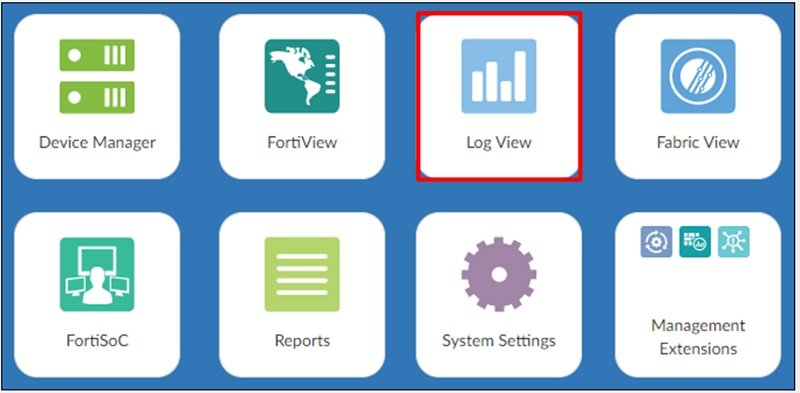
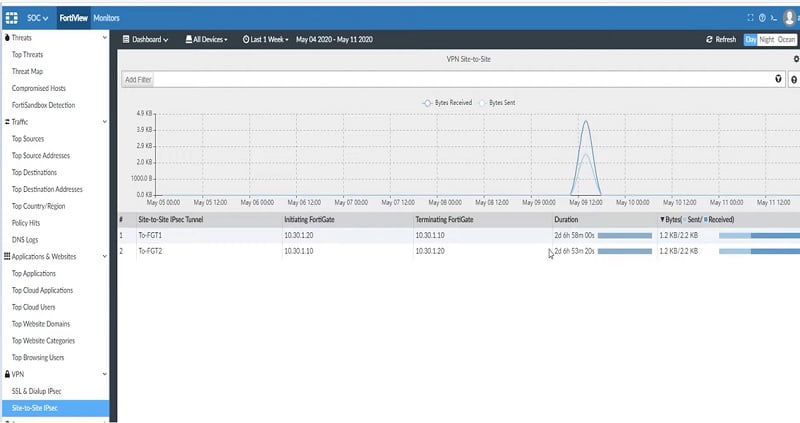
We can check below logs and types of logs in the Log View dashboard
- Threats: It fetch all the logs which has threat alerts. It covers Top Threats, Threat Map, Compromised Hosts and FortiSandbox Detection.
- Traffic: It captures normal traffic logs of registered devices. It covers top source and destination, top country/region, maximum policy hits and DNS logs.
- Applications & Websites: It covers cloud application traffic, website domains and categories and browsing users.
- VPN: It fetches VPN traffic of devices like SSL VPN or IPSec VPN.
Incidents and Events
FortiSOC has 3 dashboards that includes general overview and statistics of events. These dashboards monitor the traffic and identify the gap in the network.
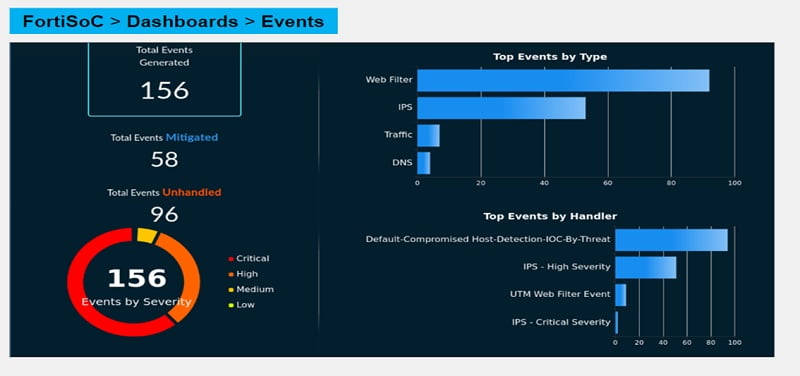
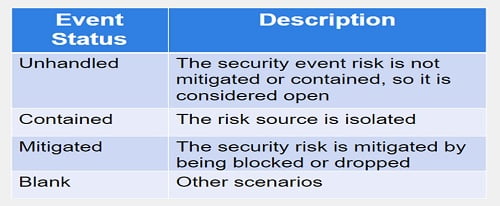
Event dashboard includes total generated events, mitigated events, and top events by handler. SOC team can easily identify the type of events needs to checked and mitigate first based on severity or priority of events.
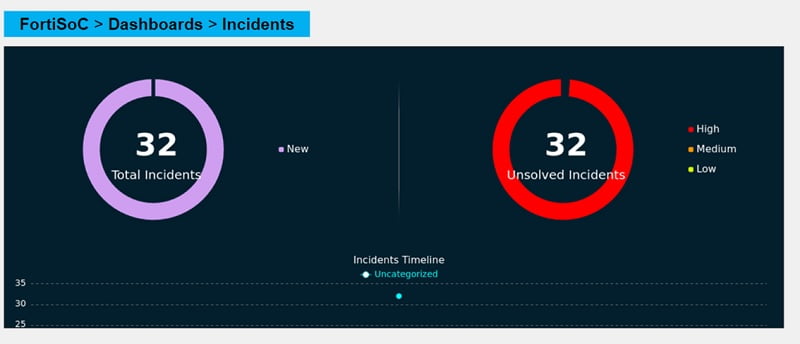
Incident Dashboards contain total incidents, unsolved incidents, and incident types. It can give a clear representation of the number of incidents hit by device.
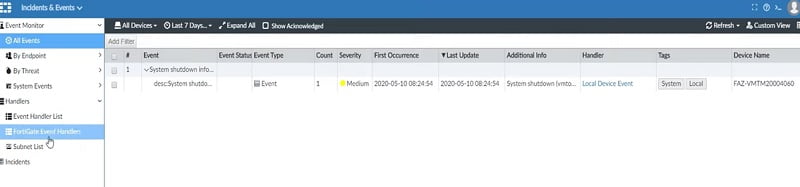
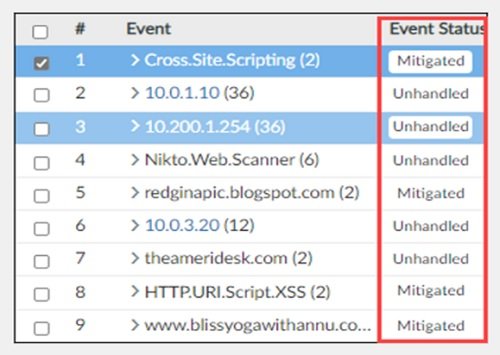
Incidents & Events: It has Event Monitor tab which covers all events of devices.
- All Events: All events generated by a device and its relevant threat are covered in this tab. Event handlers are responsible for determining if an event needs to be created.
- Some predefined event handlers available which can be cloned or customised.
- Event Monitor can generate events which are viewed in All Events.
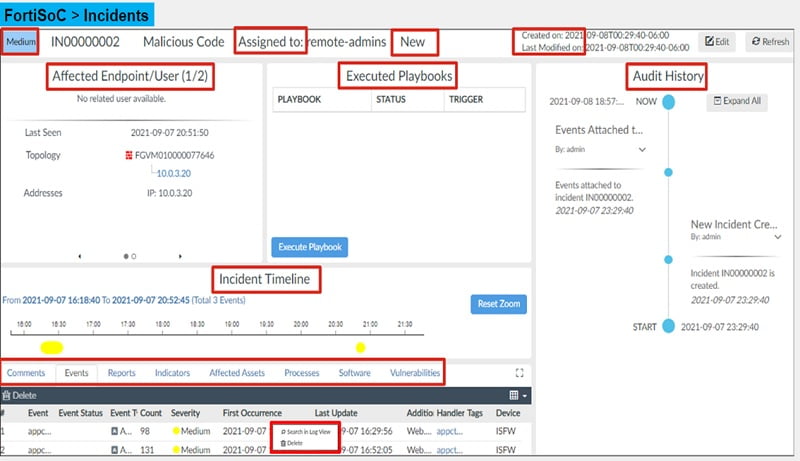
Incident can be created when an event is reported and require deep analysis. It can be created manually or automatically.
To view any incident detail,
Go to Incident and select any incident. Right click the incident and click the analysis tab. Analysis page provides all the relevant information for the incident. Please check the below analysis of an incident.
Reports
The purpose of the report is to summarise large amounts of data. Based on certain parameters FortiAnalyzer extracts data and presents it in a graphical manner that makes it easier and quicker to read.
Files/data are saved in SQL databases. SQL database log selects the query and fetch reports, pulls the database for the specific information, and generates reports. This information of log populates charts or graphical views of logs.
Before you create or generate a report, consider a few factors that make the report as effective as possible.
- Audience: who is going to investigate the report.
- Purpose: why his piece of information is required
- Level of detail: best practice is to keep report short and concise.
- Format: choose best way to represent the report.
Let’s generate a report
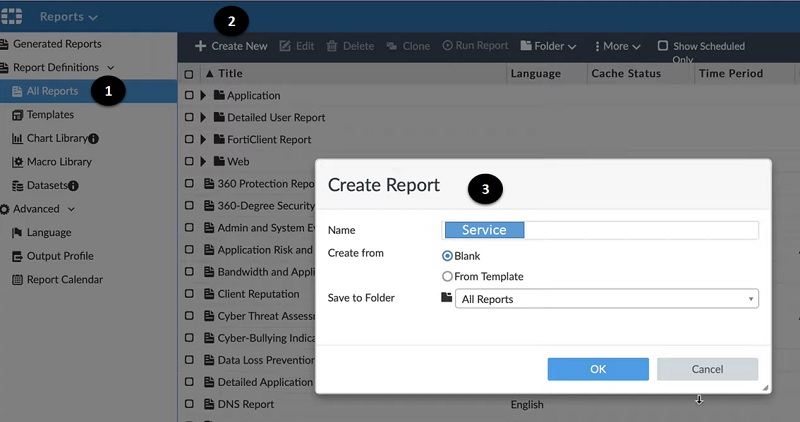
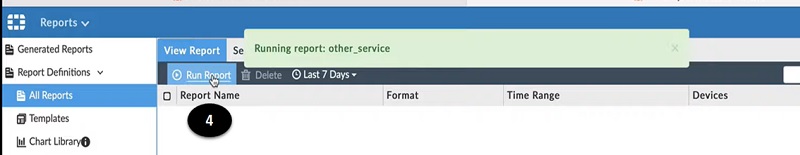
- Go to All Reports in Report tab
- Create New Report
- Give name to report and apply filter of source or traffic type
- Run Report as to generate the pdf file.
- Download report once generated on the screen.
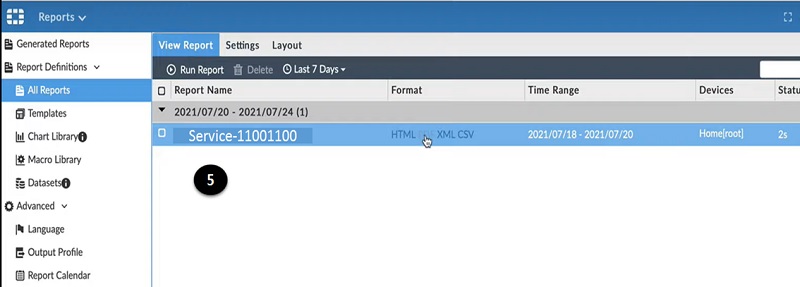
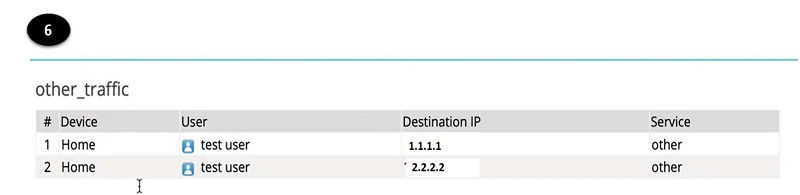
- Check the pdf file and identify the host detail and forward it to the requestor. OR keep the data for records.
Conclusion
FortiAnalyzer is an import hardware device for monitoring purposes. It helps to detect and notify SOC admin for any threat or malicious activity in the network. It is a core graphical view of reports and provides multiple features in terms of monitoring tools. It is designed for both large scale data and small offices. It is an important tool for the SOC team which improves visibility in monitoring hence recommended for all firewall or other devices monitoring teams.
No comments:
Post a Comment